When a magician takes the stage, he will wave around a wand, a hat or a cape to distract the audience’s eyes from what is happening with his other hand. Like that magician, many in the state government want to distract us from the “other hand” of public education. Unlike the magician, their cuts are real. And they hurt. Defenders of Pennsylvania’s education budget cuts point to the fact that the Commonwealth is eighth in the nation in terms of education spending as a share of the economy. But without a fair funding formula, we must look to see if that funding is actually spread to those who need it. So we did. It’s not. A new review of Pennsylvania’s education funding, perhaps the most comprehensive to date, found that PA has the third highest share of students attending financially disadvantaged school districts. The funding situation in Pennsylvania’s richest districts is so great that it appears to make up for the unacceptably high number of poor, failing districts in the state. That’s bad, but what is worse is that the gap is growing.
Pennsylvania certainly has high quality school districts—a new review gave it three of the top ten in the nation, with two of the top five in the Philadelphia area. Unsurprisingly, those two (Tredyffrin/Easttown and Lower Merion) are among the richest school districts in Pennsylvania, if not the country. It is too bad that most Pennsylvania students, unlike those in Tredyffrin/Easttown and Lower Merion, do not come from households with six figure incomes. In 2010, the study found that per student revenue was $2,000 higher in PA’s richer districts than its poorer districts. By 2013, that difference was $3,000. If you wanted to know what happens when a state dumps its funding formula, that is it. Per student spending increases in the richest districts vastly outpaced the other 80% of districts. According to the American Institute for Research, districts in the richest 5% of Pennsylvania spent 60% more per student than those in the bottom 5% in 2013.
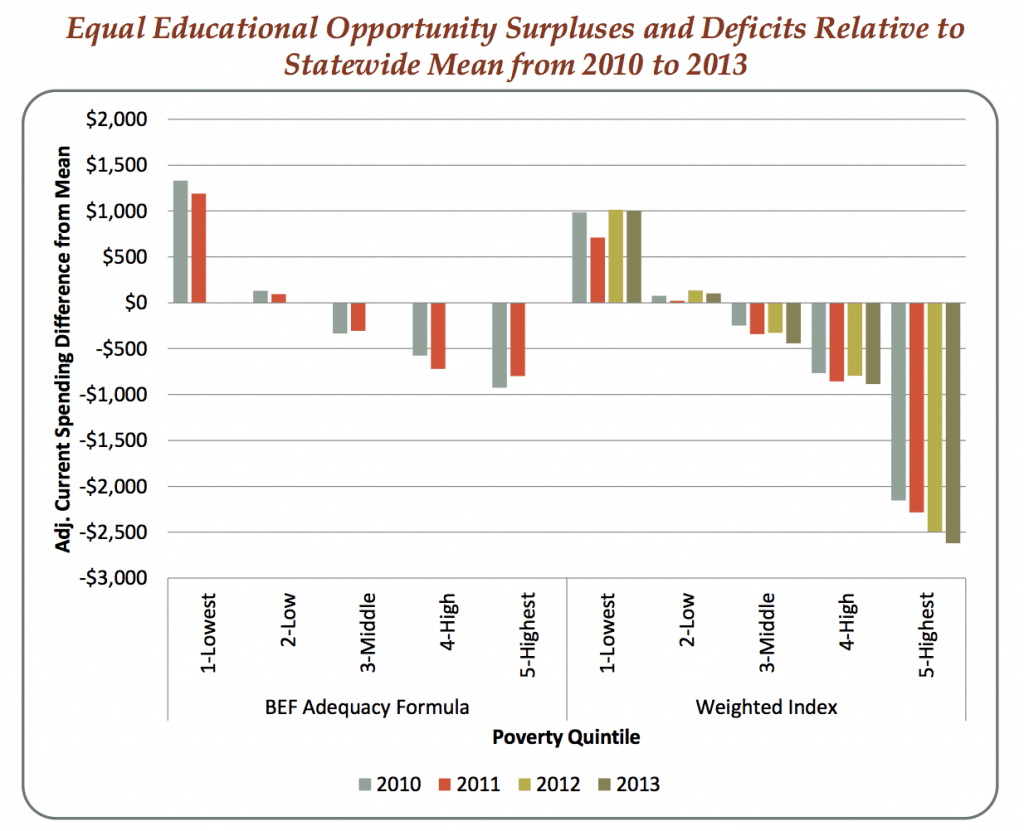
So when we say that the education cuts and lack of a fair funding formula hit poor districts the hardest, this is what we are talking about. The study found that low poverty districts spent more than $1,000 per student over the level they would need to achieve average outcomes. High poverty districts fell more than $2,500 per student short of that level, and have gotten worse every year since the education cuts. But that’s all academic, what are the actual outcomes for Pennsylvania students? 80% of students in those richer districts, the ones where spending was well above what was needed for adequacy, showed proficiency in math and reading in the latest PSSA exams. Fewer than 65% of students in the high poverty districts showed proficiency in math and less than 60% showed proficiency in reading. Both of those numbers are dropping.
American Institute for Research
So where does that leave Pennsylvania? We have some of the best, richest school districts in the country, but that only serves to distract attention from being “home to many of the most financially disadvantaged local public school districts in the nation,” thanks to being “among the most regressively funded state education systems in the nation,” with “among the lowest state aid contributions to local public school districts in the regions” due to budget cuts forcing districts to rely on property taxes. The answer is clear: Pennsylvania needs a fair funding formula for education so that funding levels are dictated by need, not by property taxes. If not, that downward trend for PA’s poorest students will continue.

